Texas Instruments Inc. (TXN) Elliott Wave technical analysis [Video]
by Peter Mathers · FXStreetTXN Elliott Wave Analysis Trading Lounge.
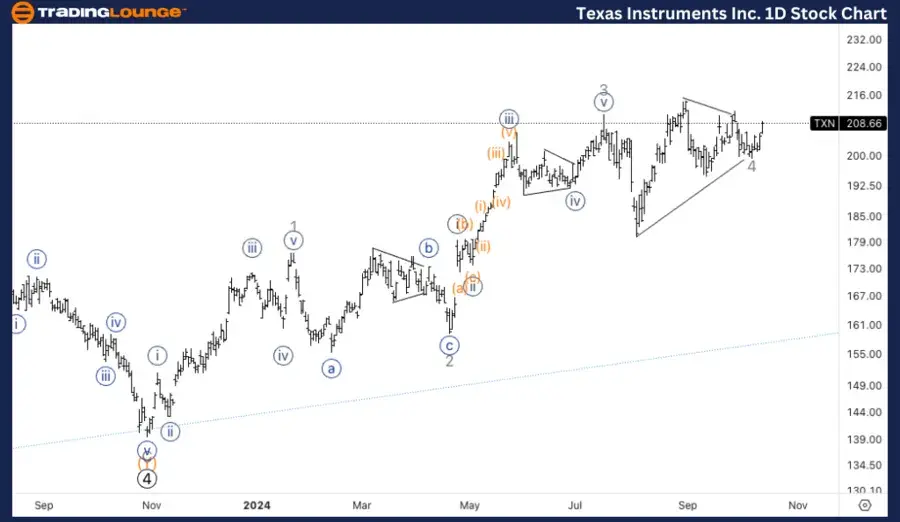
Texas Instruments Inc. (TXN) Daily Chart.
TXN Elliott Wave technical analysis
- Function: Trend.
- Mode: Impulsive.
- Structure: Motive.
- Position: Wave 4.
- Direction: Upside in wave 5.
Details:
The chart suggests that TXN is currently in the final stages of a triangle pattern within wave 4. As wave 3 previously achieved equality with wave 1, an extension in wave 5 is anticipated. The breakout from this triangle formation is expected to push the price higher, marking the beginning of wave 5.
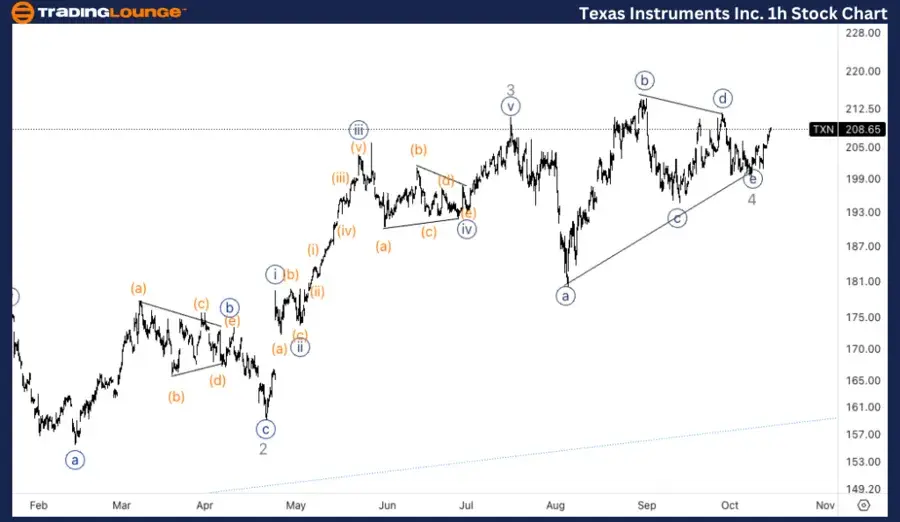
Texas Instruments Inc. (TXN) 1H Chart.
TXN Elliott Wave technical analysis
- Function: Trend.
- Mode: Impulsive.
- Structure: Motive.
- Position: Bottom in wave {e}.
- Direction: Upside in wave {i}.
Details:
The 1-hour chart suggests that TXN has likely completed its correction with wave {e} marking the end of wave 4. The price is now advancing within wave {i}, specifically in wave (iii) of {i}, indicating a resumption of upward momentum. This movement signifies the beginning of the expected wave 5 rally.
Overview of TXN’s Elliott Wave analysis
In this Elliott Wave analysis, both the daily and 1-hour charts suggest an ongoing bullish trend for Texas Instruments Inc. (TXN).
Key Insights from the Daily Chart:
- Wave 4 is forming a triangle pattern, indicating a consolidation phase.
- A breakout into wave 5 is expected, potentially driving the price higher.
- Wave 3's equality with wave 1 implies a possible extension in the upcoming wave 5.
Key Insights from the 1H Chart:
- The correction appears to have completed with wave {e}.
- The price is advancing in wave {i}, specifically within wave (iii) of {i}, suggesting renewed upward momentum.
- This movement signals the early phase of the wave 5 rally.
Technical analyst: Alessio Barretta.
TXN Elliott Wave technical analysis [Video]
Share: Feed news